EVolve Tutorial
A Tour of EVolve
Last updated: June 23, 2003

|
|
EVolve Tutorial
Last updated: June 23, 2003
|
|
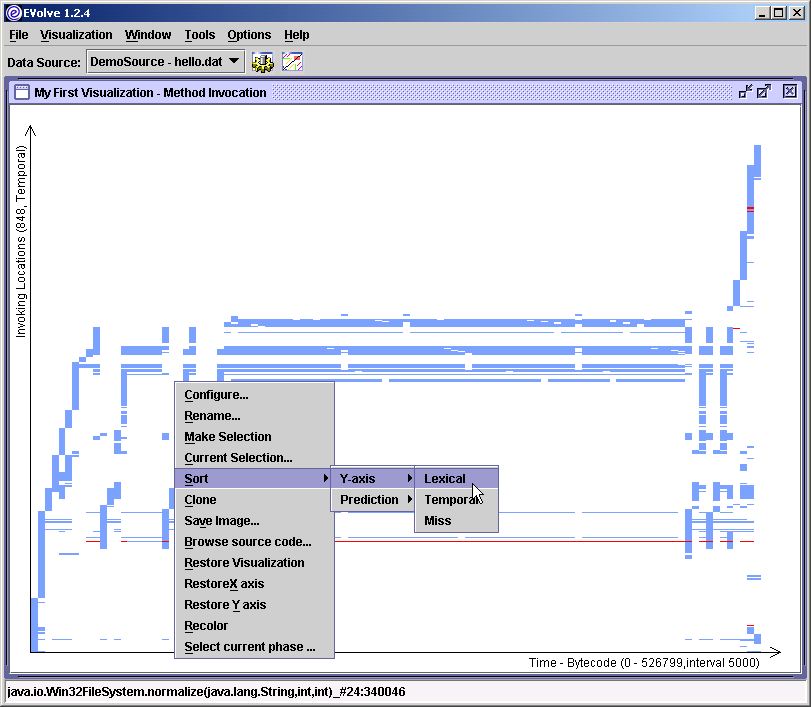
Step 8: Sorting the Result
After the visualization process is finished, the visualization window contains the graphical representation of the selected data. The red portions of the graph indicate that the invoked target method changed within the selected time period, and thus indicate polymorphic activity of the program.
Now the the Y-axis is sorted temporaly, i.e. in the order that the entities it represents occur in the trace. To change the sort scheme, right-click on the visualization window in order to display the pop-up context menu. Then select
Sort->Y-Axis->Lexical. The visualization is sorted (without having to go through the visualization process again).
<<< Previous Next >>>