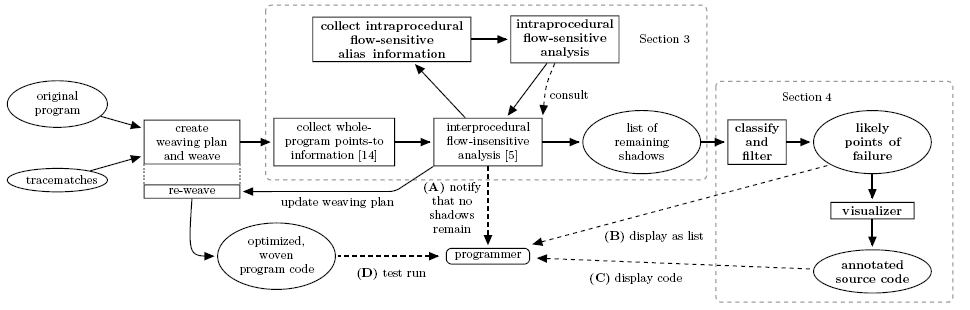
You may click some of the items on the following overview to get additional information about the respective analysis step.
Acknowledgements
We owe thanks to Manu Sridharan for help with his demand-driven points-to analysis. Stephen Fink provided valuable information about instance keys and SSA form. Brian Demsky and Nomair Naeem provided useful comments on an earlier version of this paper. We also thank the entire abc group for their continuing support. We would like to thank the anonymous referees for their detailed comments.
Download of all benchmark files
Download the complete benchmark package here (96MB). It contains:- The source code and binaries of the Soot and abc versions that we used.
- Binaries of all benchmarks that we used as well as the source code of SciMark2. (The source code of DaCapo build dacapo-2006-10-MR2 is available here.)
- Scripts to compile/optimize and run all benchmarks.
- A description of how to use those scripts: See README within the tarball.
View tracematches
You can obtain the tracematches we used as benchmarks from SVN, using:svn co https://svn.sable.mcgill.ca/sable/bench/tracematches/generic-patterns/tags/version-1.5
or you can view them directly here.
Raw benchmark results
In this document we provide the raw benchmark data (Excel 2007, Excel 95-2003).Potential points of failure
This directory contains *.PFG files for every benchmark that had potential points of failure remaining after analysis. The program points are ranked, as described in our paper. We marked actual points of failure with ACTUAL. For instance bloat-HasNext shows an actual match at position 1. Our filter algorithm would filter out all potential points of failure that have one of the following features attached: CALL, ANALYSIS_ABORTED, DELEGATE, NO_CONTEXT.Visualization of potential and actual points of failure
We provide visualuzations of potential points of failure for the following benchmark/tracematch combinations.- bloat-FailSafeIter
- bloat-HasNext
To explore the actual match in bloat-HasNext, click on any next edge within the first state machine, or click directly here. The problem seems to be that the code assumes that blocks at phi-nodes always have two predecessors. This certainly makes sense but does not seem to be enforced. - chart-FailSafeIter
- fop-FailSafeEnum
- pmd-HasNext
Positions 1 to 3 here contain safe uses of an interator where the collection is checked for non-emptiness. The suspicious code can be found at position 4, where addAccess accesses an iterator's next element without a check. - scimark-ResetRead
Here we get some false positives because the constructor of Stopwatch itself calls reset(), which leads to an "interprocedural match" that we cannot resolve with out intraprocedural analysis. - scimark-StartStart
The propety here is "two times start with no stop in between". Interestingly, the pattern start start is syntactically equivalent with next next in the HasNext pattern. So how come that we cannot remove this (spurious) match? The answer is that on an iterator one usually calls i.hasNext before calling next and that gives a negative binding, avoiding false positives. For the Stopwatch start is usually the first call. Because we soundly over-approximate the configurations at method-entry, this lets us reach the final state already at this first call to start. To overcome this imprecision, we would require either a more precise approximation at method entry or a "freshness rule" that exploits that the Stopwatch at line 19 is fresh at method entry, and therefore start cannot have been called on that Stopwatch before. We implemented the latter, but it only helped remove two potential points of failure in all our benchmarks, so we decided to exclude the rule again because it largely complicates the abstraction. We leave a better approximation of initial configurations to future work.
Please note that our visualization tool is meant to be a prototype. In the long term, we plan proper integration with the Soot Eclipse plugin, including clickable gutter annotations like in the AspectJ Development Tools and a sorted and filterable list view of all potential points of failure. Programmers will then be able to inspect these program points directly within the Eclipse IDE and mark uninteresting potential points of failure so that they will be ignored on future analysis runs until a related source file changes. Furthermore, the manual marking could be fed back to our machine learning algorithm to improve the ranking on the fly, as Kremenek et al. suggested at FSE 2004.
Actual points of failure
In this PDF document we listed some of the program points matched by our static analysis and explain why they may be of interest to the programmer. In particular we show the actual defects that wwe found with our tool.Weka inputs and output
This file shows the input file that we gave to Weka. It was directly distilled from the *.PFG files. Weka generated the following output (full output here):CALL = 0 | ANALYSIS_ABORTED = 0 | | DELEGATE = 0 | | | NO_CONTEXT = 0: ACTUAL (11.0/1.0) % classification as true positive correct for 11 cases, wrong for 1 case | | | NO_CONTEXT = 1: FP (4.0/1.0) % classification as false positive correct for 4 cases, wrong for 1 case | | DELEGATE = 1: FP (10.0) % classification as false positive correct for (all) 10 cases | ANALYSIS_ABORTED = 1: FP (30.0) % classification as false positive correct for (all) 30 cases CALL = 1: FP (406.0/1.0) % classification as false positive correct for 406 cases, wrong for 1 caseYou may also want to read Jörg Tiedemann's manual on interpreting Weka output.