EVolve Tutorial
A Tour of EVolve
Last updated: June 23, 2003

|
|
EVolve Tutorial
Last updated: June 23, 2003
|
|
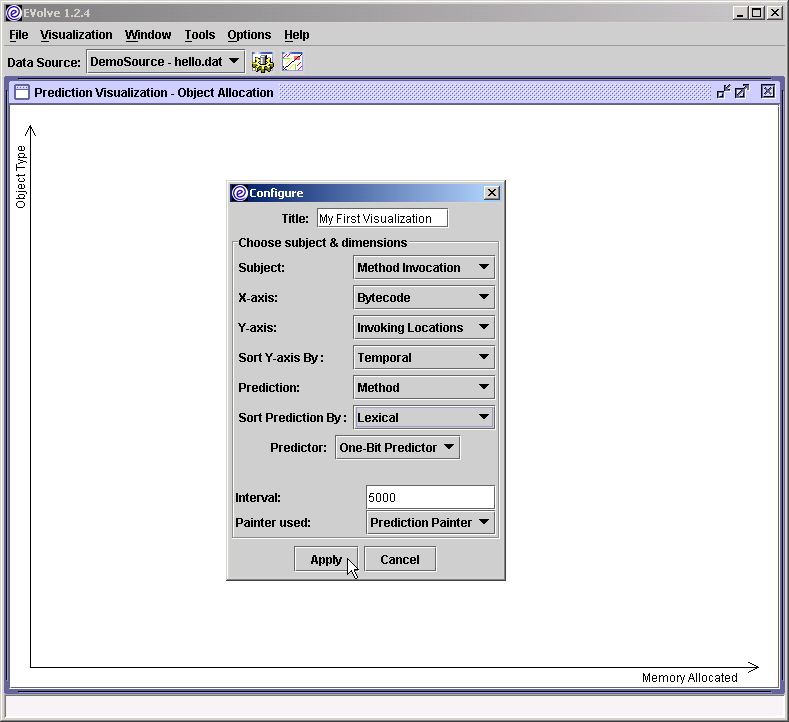
Step 4: Configuring the Visualization
The configuration dialog allows to set options for a particular visualization. First, let's change the displayed title of the visualization. Change the text in the "Title" entry box to read "My First Visualization".
Next, we need to select the subject of the visualization (i.e. the kind of events from the trace to be visualized). In this case, we will select "Method Invocation". EVolve automatically updates the other combo boxes according to the selected subject. Now, we must choose what will be assigned to both axes. We select "Bytecode" for the X-axis and "Invocation Locations" for the Y-axis.
Next, we have to choose the prediction method. In this case, we want the predictor to predict methods, so we pick "Method" from the "Prediction" combo box. Since EVolve only contains one default predictor, we do not need to change the value of "Predictor" combo box. The end user can change the value of sample size (interval) to make EVolve adapt to data traces with different sizes. Normally we use large sample sizes for large traces. In this example,we use 5000. At last, the end user need choose a painter to paint this visualization. For prediction visualization, there is only one available painter, so we do not change the value of this combo box. Before submitting these configuration, we can also select the sort scheme as we want, here we decide to sort the Y-Axis by temporal.
Clicking
Applywill commit the changes, and allow us to move to the next step.
<<< Previous Next >>>